p50, p95, p99: What Latency Percentiles Actually Mean for Your Node.js App
Your monitoring dashboard shows average response time: 45ms. Looks great. Your users are complaining the app is slow. Both things are true. Here's why. Imagine 100 API requests. 99 of them take 10ms. One takes 5000ms. Average: (99 × 10 + 5000) / 100 = 59.9ms Your dashboard shows ~60ms average. Looks
⚡
Key Insights
10 editorial insights.
AiFeed24 Team·⏱ 1 min read·News
Deep Analysis
Multi-Source Intelligence
Tags:#cloud
Found this useful? Share it!
Related Stories
📰
Your Baby Monitor's Biggest Security Flaw Isn't Hackers. It's the Company That Built It.
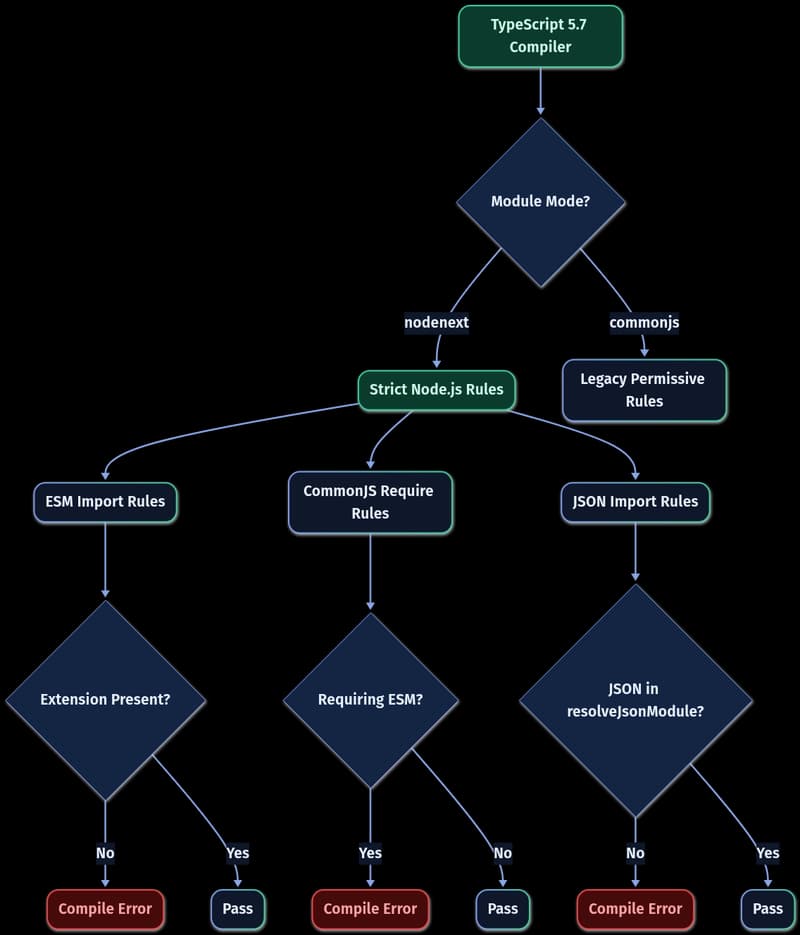
TypeScript 5.7's `--module nodenext` Disrupts Legacy Express Applications
📰
OpenCode: a alternativa open source ao Claude Code (sem lock-in de modelo nem de nuvem)
📰